Excel Percentage Formula: Learn It Once, Use It Forever
Real-Life Professional Examples Used in Companies
In the current business scenario, Excel is not merely a spreadsheet tool but the language of business. Businesses take decisions involving lakhs or even crores of rupees based on the analysis of numbers in Excel. The use of percentage formulas to track revenue, assess employee performance, review sales, and manage business expenses makes them an integral part of business reporting.
As opposed to the classroom example, the business world involves actual numbers, actual pressure, and actual consequences. A single mistake in a percentage formula can result in incorrect predictions, wrong incentives, or wrong strategic choices. This is why professionals need to understand percentage formulas not only to calculate them but also to know when and why to use them.
Let’s look at actual business examples and see how teams use Excel percentage formulas on a daily basis.
Why Companies Rely on Percentage Calculations
In a professional setup, percentages assist businesses in the following ways:
- Accurate measurement of performance
- Comparison of performance over a period of time
- Monitoring of increase, decrease, and efficiency
- Effective representation of data to the management and clients
The management does not require figures; rather, they require percentages that speak louder than words.
Corporate Formula Everyone Uses
Regardless of the department, the basic formula looks like this:
Percentage = (Actual Value / Target Value)
Excel Formula:
=Actual/Target
Use Percentage (%) format, and your information is ready for the boardroom.
Example 1: Sales Target Achievement (Sales Department)
Company Scenario:
A company sets monthly sales targets for its sales executives.
| Executive | Target (₹) | Achieved (₹) |
| Rahul | 1,000,000 | 850,000 |
Excel Formula:
=850000/1000000
Result:
85% Target Achieved
Why This Matters:
- The management can see the performance instantly through achievement percentages, and this helps in quick decision-making.
- The organizations usually connect incentives and bonus payments to these percentages to ensure that the performance is fair and transparent.
- The teams can easily identify areas of poor performance and work on them.
- The companies use these metrics extensively in sales dashboards, CRM reports, and monthly review meetings.
Example 2: Year-on-Year Revenue Growth (Finance Team)
Company Scenario:
A company compares its annual revenue to track business growth.
| Year | Revenue (₹) |
| 2024 | 25,000,000 |
| 2025 | 32,500,000 |
Excel Formula:
=(32500000-25000000)/25000000
Result:
30% Revenue Growth
Why Finance Teams Use This:
- Used in annual reports and investor presentations
- Helps leadership understand business momentum
- Supports strategic planning and forecasting
- Without percentage growth, raw revenue numbers don’t show performance clearly.
Professional Tip: Always Format Percentages Correctly in Excel
In the corporate world, it is not only the outcome of a percentage calculation that matters but also how the calculation is done. A percentage calculation that appears to be correct but is actually done incorrectly can result in errors, misconstruction, and even financial danger.
This is why professionals always remember one thing when working with Excel:
- Never enter percentages manually. Always calculate them.
- Common Mistakes to Avoid in Corporate Excel Files
- Entering the % symbol manually
Entering 75% directly into a cell may appear to be correct, but it goes against the logic of the spreadsheet. Excel recognizes it as a constant, not as a value that has been derived from data.
Copying values from calculators or emails
When you copy a percentage value rather than a formula, you eliminate traceability. If the underlying values change, the percentage value will not be updated, resulting in inconsistent reporting.
The Corporate Best Practice Always use formulas combined with Percentage (%) formatting
- Enter the formula (e.g., =Actual/Target)
- Apply Percentage format using Excel’s formatting tools
Let Excel handle recalculation automatically .This will ensure that your Excel files are always scalable, reliable, and professional.
Why Management-Ready Excel Files Must Be Built This Way
Senior management and stakeholders expect Excel reports to meet three critical standards:
1. Dynamic
Business data changes frequently daily sales, monthly targets, quarterly results.
A professionally built Excel file updates instantly when inputs change, without manual corrections.
2. Auditable
Finance, HR, and operations teams often need to explain how a number was calculated.
Using formulas allows reviewers, auditors, and managers to trace results back to the source data with confidence.
3. Easy to Update
In meetings, managers often ask “What if we change this number?”
With proper formulas, answers are available in seconds, not after rebuilding the report.
A single change in one cell should automatically update:
- Percentages
- Charts
- Dashboards
- Summary metrics
That’s the hallmark of a professional Excel model.
How Companies Display Percentage Data
In business reporting, percentages are less likely to be presented alone since, on their own, percentages do not provide the context necessary for decision-making. In business, percentage information is presented in a way that enables management to interpret business performance. This ensures that the percentage information provided does not exist in isolation but adds meaning to business discussions.
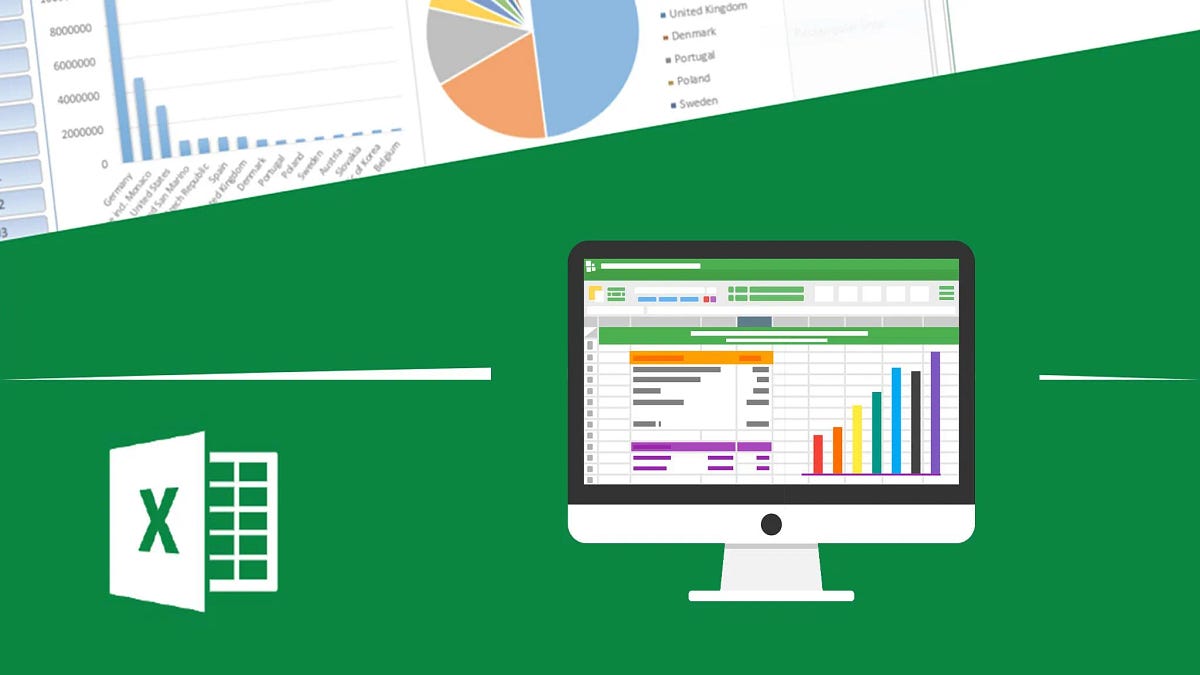
Performance Dashboards
Contemporary organizations are big on performance dashboards that integrate percentages, actual numbers, and graphical elements like colors and progress bars. These dashboards are directly connected to the Excel data and automatically update whenever the underlying numbers change. The teams make use of these dashboards during their weekly and monthly meetings to assess their performance and detect any possible problems.
Monthly and Quarterly Review Slides
In leadership and presentation contexts, percentages are important for summarizing business performance. Monthly and quarterly review slides typically feature revenue growth percentages, achievement ratios, and cost savings. These numbers have a direct impact on strategic planning, budgeting, and future actions, so accuracy and clarity in percentage calculations are critical.
The Bigger Picture: Excel Percentages Power Enterprise Tools
The calculation of percentages in Excel has applications that go beyond the spreadsheet and form the basis of enterprise solutions. These calculations automatically feed into Power BI dashboards, MIS reports, and boardroom presentations, as well as data exports for enterprise resource planning and analytics software. When teams make percentage calculations incorrectly in Excel, this mistake automatically propagates into all related systems.
Final Corporate Insight
In today’s corporate world, the calculation of percentages in Excel is no longer a sophisticated skill it is a basic requirement. Individuals who know how to calculate and display percentages accurately are able to communicate their findings effectively, create trustworthy and auditable reports, answer management queries confidently, and help make data-driven decisions